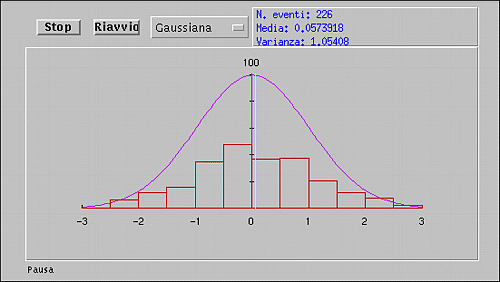

- Scripts in conjunction with the use of forms have been
created to plot histograms and functions. In this way students can compare
different distributions and verify their behaviour by changing
the parameters.
Scripts have been created using HBOOK
[7],
HPLOT
[8]
and HIGZ
[9]
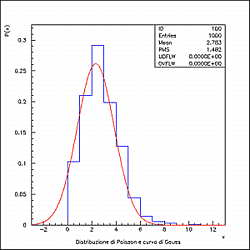
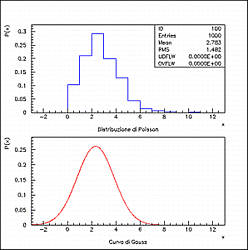
routines from CERN software libraries to produce Postscript files, and
then the IMAGEMAGICK
[10]
package was used to obtain inlineable GIF files (see Fig. 6).

|

|
This interactivity should stimulate students to repeat experiments, make comparisons, and develop their own conclusions on the different effects generated with different parameter values.
![]()


